Surface the operational data your leadership team actually needs. Operations Intelligence provides real-time dashboards, automated reporting, engagement metrics, and trend analysis — configured to show what matters, not just what’s easy to measure.
Executive and operational dashboards
High-level KPIs for platform operators — active users, engagement rates, workflow completion, SLA performance. One screen that tells you where the organisation stands.
Multi-section summative report with Chart.js visualisations — Daily Active Users trend, Signup Funnel, Material Conversion rates, Search Volume, per-content performance, geographic breakdown.
29 individually configurable dashboard panels covering engagement, workflow, user activity, and content performance. Show the metrics relevant to your role — hide the ones that aren’t.
The metric snapshot cron captures platform-wide KPIs every day — ILT enrolment counts, cohort completion rates, workflow SLA performance — enabling trend analysis across any time window.
Engagement and content metrics
Views, impressions, engagement depth, and internal link performance tracked per lesson. Content performance segmented by type — technical, general, AI-generated — to surface what resonates.
Bottleneck heat maps, path frequency analysis, median cycle time, and SLA breach rates per workflow template. Identify which steps are slowing down your team and act on data, not intuition.
Pre/post quiz score comparison per learner. Cohort-level improvement averages. ILT enrolment counts vs. capacity. Training effectiveness measured, not assumed.
Automated email summary of platform activity delivered on a configurable schedule. Keeps your leadership team informed without requiring them to log in and check dashboards.
See your operations clearly
A demonstration configured around the metrics that matter most to your organisation.
Live deployment — WhereWeLearn.com
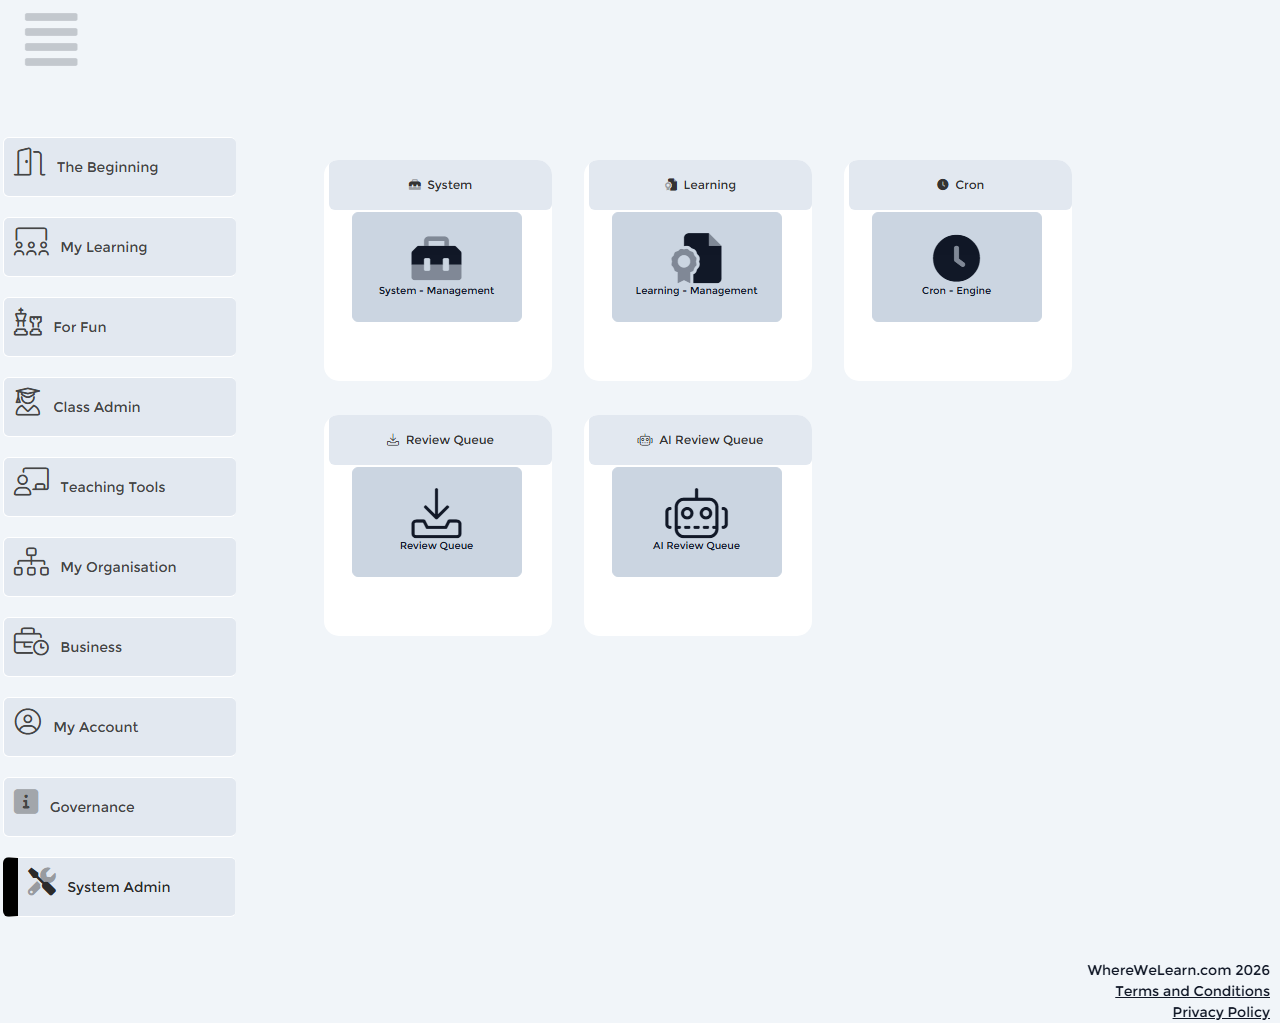
Admin dashboard — navigation, workflow tiles, AI Review Queue